SpringBoot使用prometheus监控
本文共 3623 字,大约阅读时间需要 12 分钟。
本文介绍SpringBoot如何使用Prometheus配合Grafana监控。
1.关于Prometheus
Prometheus是一个根据应用的metrics来进行监控的开源工具。相信很多工程都在使用它来进行监控,有关详细介绍可以查看官网:。
2.有关Grafana
Grafana是一个开源监控利器,如图所示。
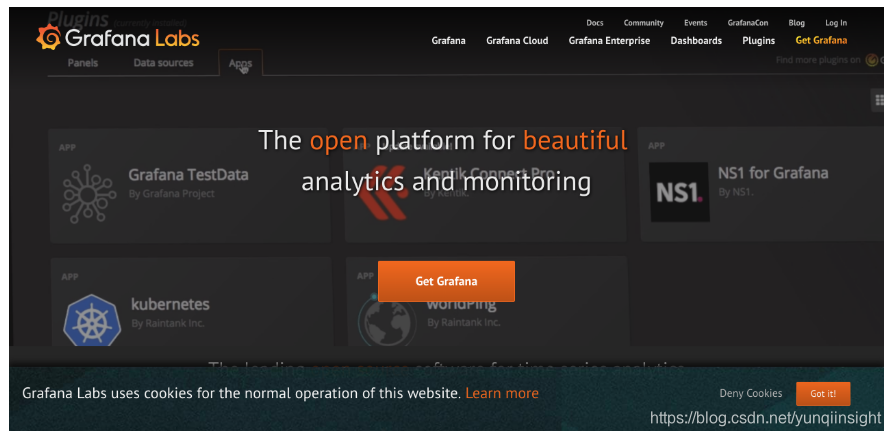
从图中就可以看出来,使用Grafana监控很高大上,提供了很多可视化的图标。
官网地址:
3.SpringBoot使用Prometheus
3.1 依赖内容
在SpringBoot中使用Prometheus其实很简单,不需要配置太多的东西,在pom文件中加入依赖,完整内容如下所示。
4.0.0 org.springframework.boot spring-boot-starter-parent 2.1.3.RELEASE com.dalaoyang springboot2_prometheus 0.0.1-SNAPSHOT springboot2_prometheus springboot2_prometheus 1.8 org.springframework.boot spring-boot-starter-actuator org.springframework.boot spring-boot-starter-web org.springframework.boot spring-boot-starter-test test io.micrometer micrometer-registry-prometheus 1.1.3 org.springframework.boot spring-boot-maven-plugin
3.2 配置文件
配置文件中加入配置,这里就只进行一些简单配置,management.metrics.tags.application属性是本文配合Grafana的Dashboard设置的,如下所示:
spring.application.name=springboot_prometheusmanagement.endpoints.web.exposure.include=*management.metrics.tags.application=${spring.application.name} 3.3 设置application
修改启动类,如下所示.
@SpringBootApplicationpublic class Springboot2PrometheusApplication { public static void main(String[] args) { SpringApplication.run(Springboot2PrometheusApplication.class, args); } @Bean MeterRegistryCustomizer configurer( @Value("${spring.application.name}") String applicationName) { return (registry) -> registry.config().commonTags("application", applicationName); }} SpringBoot项目到这里就配置完成了,启动项目,访问,如图所示,可以看到一些度量指标。
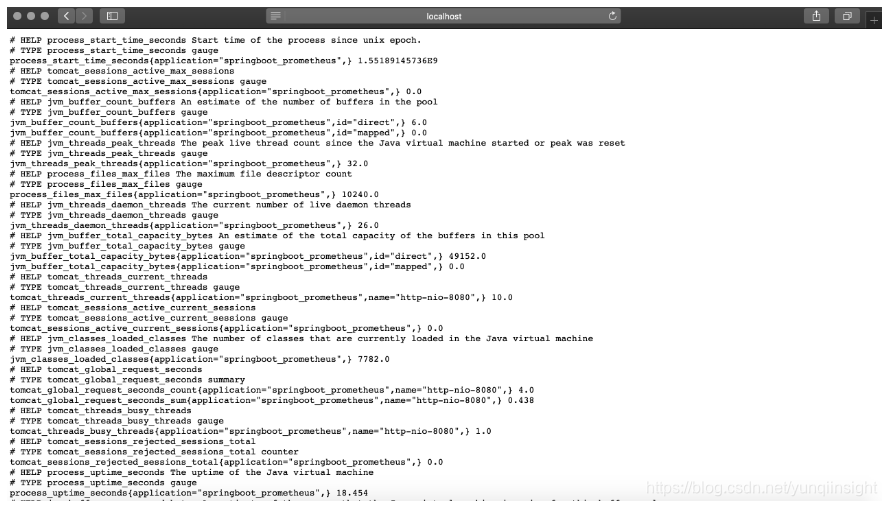
4.Prometheus配置
4.1 配置应用
在prometheus配置监控我们的SpringBoot应用,完整配置如下所示。
# my global configglobal: scrape_interval: 15s # Set the scrape interval to every 15 seconds. Default is every 1 minute. evaluation_interval: 15s # Evaluate rules every 15 seconds. The default is every 1 minute. # scrape_timeout is set to the global default (10s).# Alertmanager configurationalerting: alertmanagers: - static_configs: - targets: # - alertmanager:9093# Load rules once and periodically evaluate them according to the global 'evaluation_interval'.rule_files: # - "first_rules.yml" # - "second_rules.yml"# A scrape configuration containing exactly one endpoint to scrape:# Here it's Prometheus itself.scrape_configs: - job_name: 'prometheus' static_configs: - targets: ['127.0.0.1:9090']###以下内容为SpringBoot应用配置 - job_name: 'springboot_prometheus' scrape_interval: 5s metrics_path: '/actuator/prometheus' static_configs: - targets: ['127.0.0.1:8080']
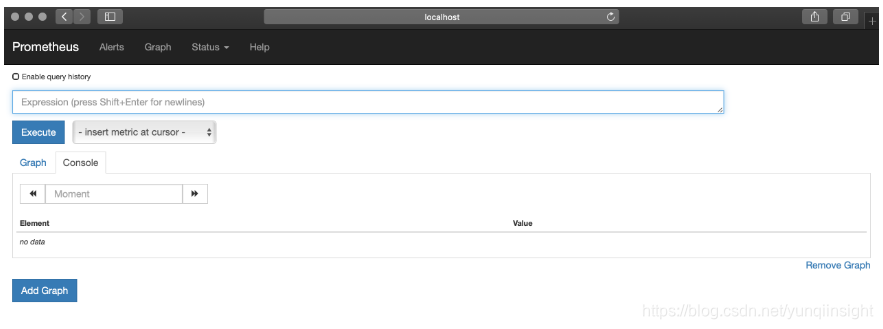
4.2 启动Prometheus
启动Prometheus,浏览器访问,查看Prometheus页面,如图所示。
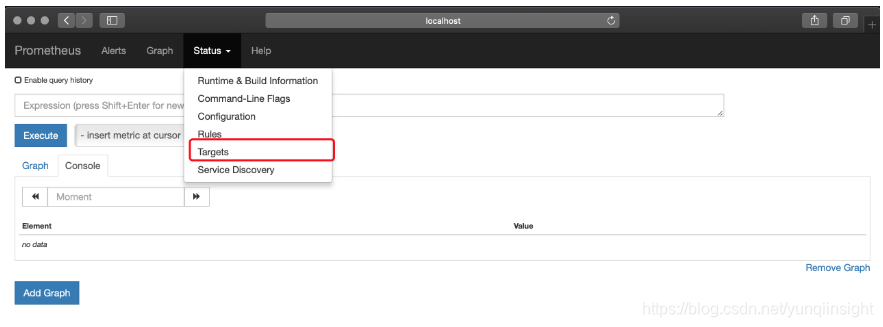
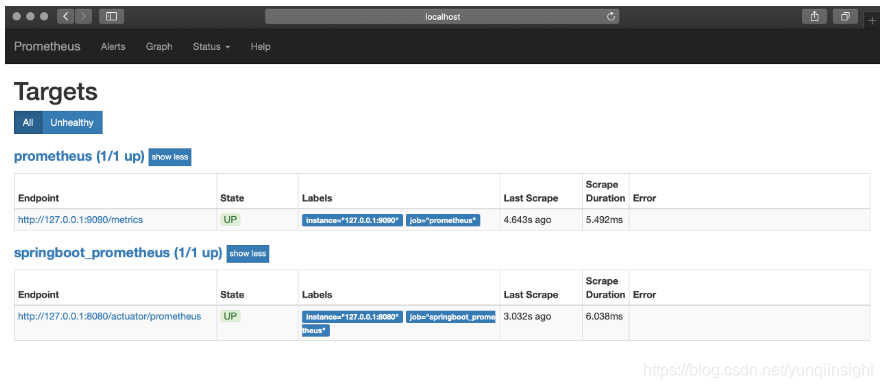
点击如图所示位置,可以查看Prometheus监控的应用。
列表中UP的页面为存活的实例,如图所示。
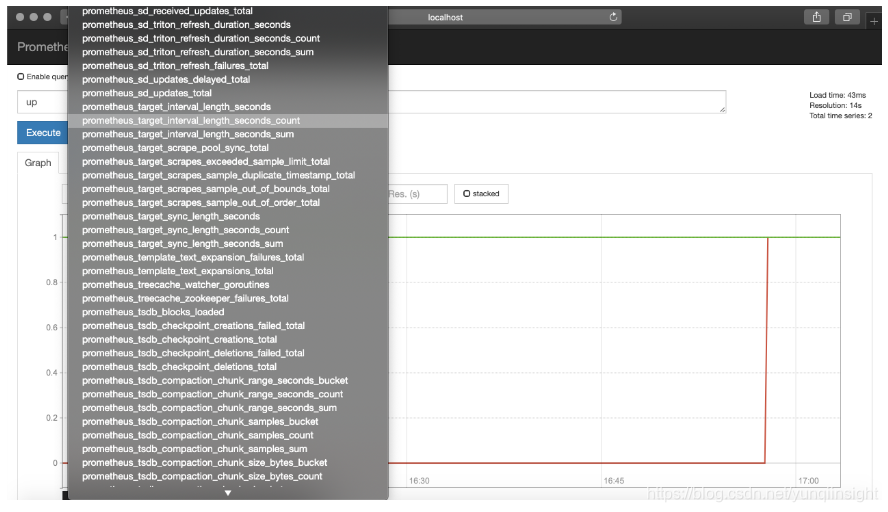
也可以查看很多指数,如下所示。
5.Grafana配置
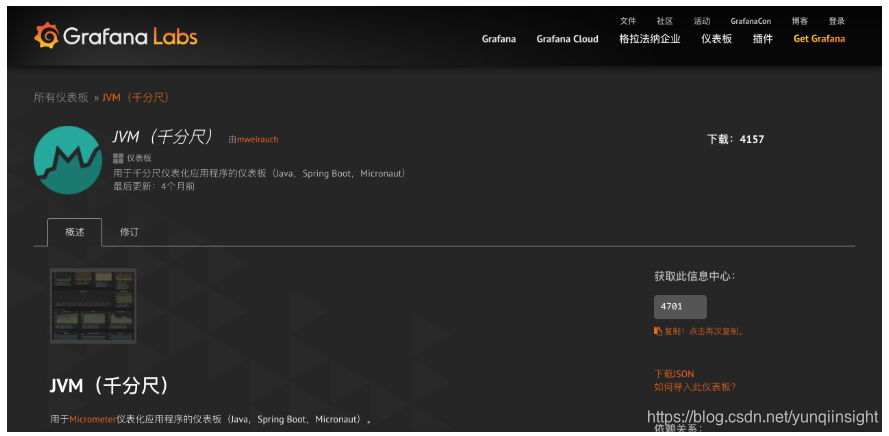
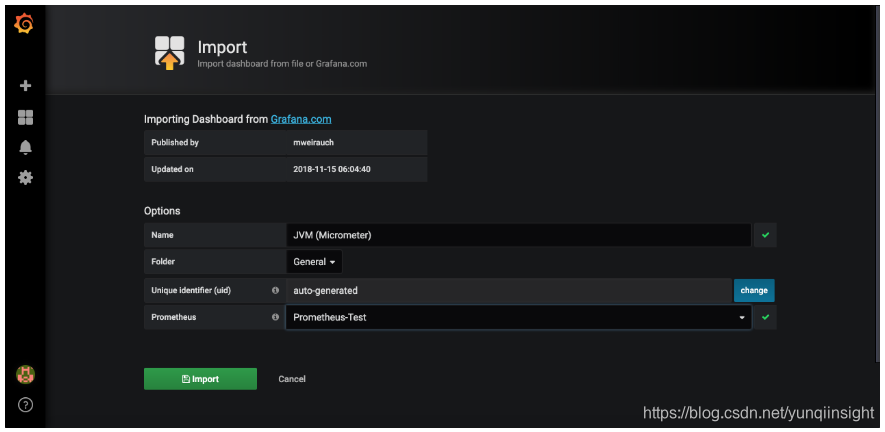
启动Grafana,配置Prometheus数据源,这里以ID是4701的Doshboard为例(地址:)如图。
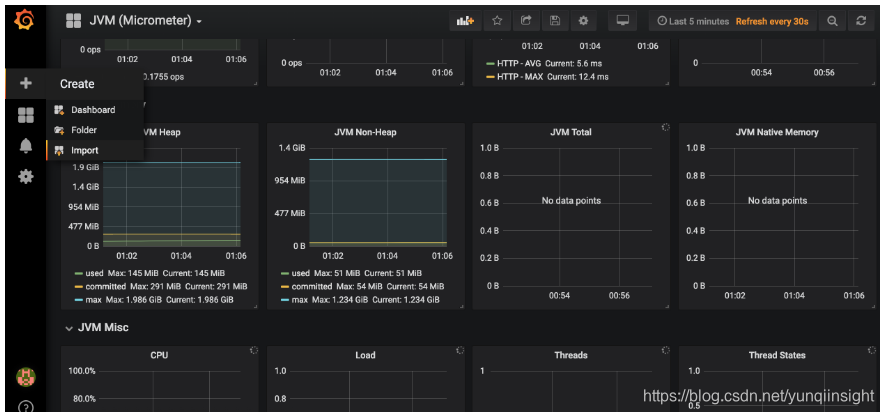
在Grafana内点击如图所示import按钮
在如图所示位置填写4701,然后点击load。
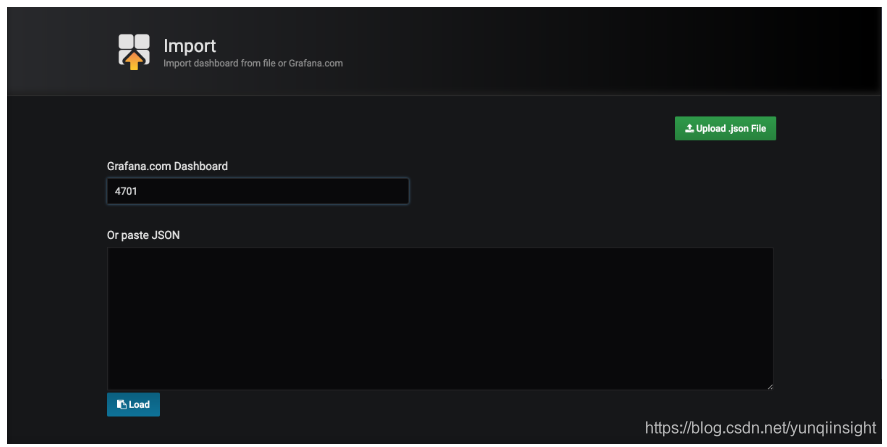
接下来导入Doshboard。
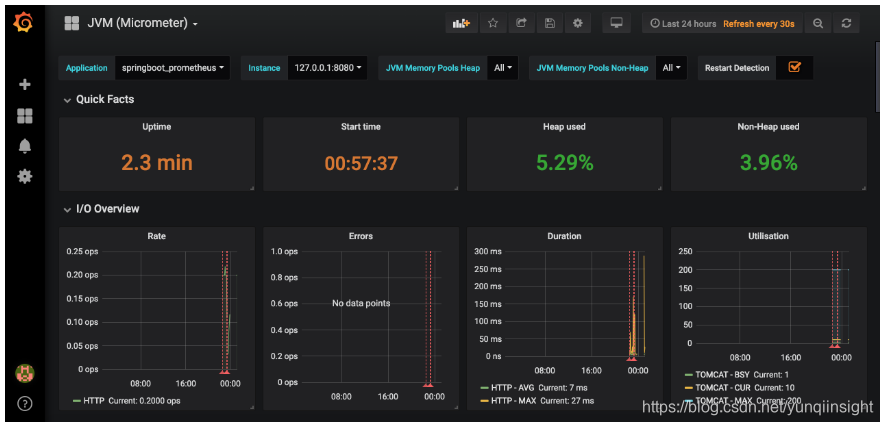
导入后就可以看到我们的SpringBoot项目对应的指标图表了,如图。
6.源码
源码地址:
本文为云栖社区原创内容,未经允许不得转载。
你可能感兴趣的文章
ng build --aot --prod生成文件报错
查看>>
ng 指令的自定义、使用
查看>>
ng6.1 新特性:滚回到之前的位置
查看>>
nghttp3使用指南
查看>>
【Flink】Flink 2023 Flink 自动化运维的大规模落地实践
查看>>
Nginx
查看>>
nginx + etcd 动态负载均衡实践(一)—— 组件介绍
查看>>
nginx + etcd 动态负载均衡实践(三)—— 基于nginx-upsync-module实现
查看>>
nginx + etcd 动态负载均衡实践(二)—— 组件安装
查看>>
nginx + etcd 动态负载均衡实践(四)—— 基于confd实现
查看>>
Nginx + Spring Boot 实现负载均衡
查看>>
Nginx + Tomcat + SpringBoot 部署项目
查看>>
Nginx + uWSGI + Flask + Vhost
查看>>
Nginx - Header详解
查看>>
nginx - thinkphp 如何实现url的rewrite
查看>>
Nginx - 反向代理、负载均衡、动静分离、底层原理(案例实战分析)
查看>>
Nginx - 反向代理与负载均衡
查看>>
nginx 1.24.0 安装nginx最新稳定版
查看>>
nginx 301 永久重定向
查看>>
nginx 301跳转
查看>>